public Real time front-end cluster monitor
To monitor the front-end cluster in real time, you need to do:
- Log in to the WordFrame Integra Core Administration
- Click on the "Architect" tab in the upper left corner
- Click on the "Platform monitoring" menu in the main navigation bar
- Click on the "Cluster monitor" link in the "Front-end cluster" section on the left of the screen
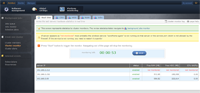
- Press the "Start" button to trigger the real-time presentation of specific information about all the cluster members
The hardware specific data is provided by the WordFrame Agent service that needs to be installed and running on all servers that have the WordFrame application installed. This service is vital for the system as it handles many tasks on updating and keeping the platform in good shape.
The monitoring lists the following information in real time:
- Server IP
- The primary IP address of the cluster member. If two applications are running on the same webserver, this IP address could be duplicated.
- Status
- Whether or not, the webserver was enabled to execute background jobs when the monitor log was created.
- Free RAM (MB)
- How much free RAM the webserver had when the monitor log was created.
- Free HDD (MB)
- How much free hard disk space the webserver had when the monitor log was created.
- CPU Util(%)
- What was the CPU utilization when the monitor log was created.
Last edited by Boz Zashev on 29 Sep 2010 | Rev. 1 |
This page is
public |
Views: 1
Comments:
0 |
Filed under:
Platform monitoring |
Tags: